Table of Contents
As cryptocurrencies are acquiring wider acknowledgment in almost all countries, it becomes important to understand the concept.
Evaluating price charts is an indispensable proficiency in crypto trading. Let’s understand the main root of this fuss, i.e., Cryptocurrency or crypto.
Crypto is a kind of digital currency and series of binary data. It utilizes cryptography and uses it as the medium of exchange or payments.
Crypto makes its value keep on fluctuating unpredictably in a wide range. This fluctuation s can be why people can make money from this in the first place and understand its basic concept.
Crypto Charts
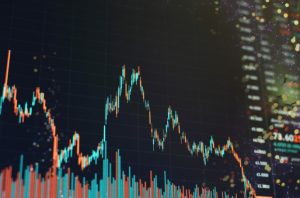
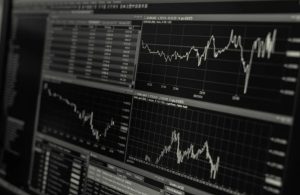
Crypto charts are graphical representations of price, volume, and periods in the past. The charts generate patterns based on the digital currency’s past price movements and assist in predicting the future trends, and are used to identify best return investment opportunities. Through such information, you can change the market conditions to work in your favor.

The charts outline all the basic details such as past and present price activities that have occurred over a period, from minutes to seconds, days to weeks, months, and even years.
It might appear to be a multifaceted process, but it is crucial to understand the essentials.
The charts aim to showcase the trading pair, period, and platform, indicating the market price’s open, high, low, and close timeframe.
The bottom line specifies dates, and the sideline directs to price increments.
Volume or moving averages are the technical indicators that are seen and proceed with the commencing and ending of each trading session.
Japanese Candlesticks Chart
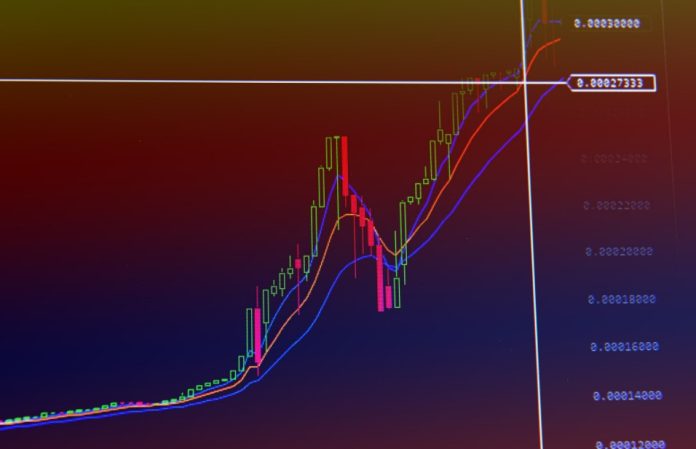
Japanese Candlestick is one of the regularly used Crypto charts by crypto traders available in the market. Well, the reason behind the success of Japanese Candlestick is it provides additional information via candles. The candles displayed on the chart are of two colors – Red and Green.
- Red Candle indicates the fall in the price of the asset or possession. The commencing price was higher than the closing price in the stated period.
- Green Candle indicates a green signal, i.e., the price of the possession rose. The commencing or initial price was lower than the closing or ending price in the stated period.
These candles supply a great bunch of information with a single candle. The size, shape, duration, and color of these sticks change occasionally depending upon the analysts, buyers, and traders.
Chart Patterns
They give us an indication of possible reversal and market sentiment, which can help us identify possible entries in the market.

The following are the categorized patterns of the charts:
Hammer candle pattern
The bullish hammer is a reversal pattern that often occurs at the bottom of the trend downward. This pattern portrays a strong bear push down that was finally overshadowed by the buying power.
Bullish Engulfing candle Pattern
It is a reversal pattern in which the green candle submerges the last candle. This pattern showcases that the sellers were tired, and buying patterns hopped.
Shooting Star Candle Pattern
This pattern has a candle with an upper wick and no bottom wick. It indicates a strong resistance in the buyers.
Morning star Candle Pattern
Morning star Candle Pattern forms when a Doji appears, meaning nobody or a few wicks. The strong upward advance follows it. Indicates a strong downward flow by sellers.
Bearing Engulfing Candle Pattern
When the red candle submerges the green candle fully, this can signify a bearish reversal.
Evening Star Candle Pattern
It comprises a Doji and results in a sharp fall. It occurs at the peak of bullish advance.
Technical Analysis and Patterns
One of the tools used is to be aware of the possible future price movement of the currency. It analyzes the past price deviations and trading actions.
Technical analysis patterns are the lines or shapes seen in a chart. It becomes important to observe them understand the price movements.
Support and resistance
Support level means that the price level of a particular asset does not fall for some stated time.
Resistance level means that the price level at which the asset is right now won’t rise any further.
Head and shoulders
These are reversal patterns visible at either the top or bottom of the trend. It depicts a huge pushback or pullback, seen as a tug-of-war between the buyers and sellers.
Wedges
This pattern occurs when the trend starts to end, resulting in breakouts. Markets tend to move to and fro until their movement is in a firm direction.
Technical Indicators
Technical Analysis contains indicators that supply traders with a unique perspective on the market conditions such as momentum, volatility, and volume.

Moving Average Convergence Divergence (MACD)
This indicator is in the form of a trial engaging two meetings and deviating moving averages. They show whether an asset is oversold or overbought.
Relative Strength Index
RSI is a trend that guides whether the asset is oversold and overbought with the arrival of any correction.
RSI = 100-(100/1-RS)
RS = the average days for which the asset was up and down.
RSI falls between 0 to 100.
- i) If RSI is more than 70, the asset is likely to fall.
- ii) If RSI is less than 30, the asset is expected to rise.
Bollinger Bands
These are moving averages that show an asset’s volatility with its two-standard deviation.
Extension Levels
This indicator is also called Fibonacci Retracement, specified as mathematical ratios. They tell the traders how far the price can move after the tieback. The levels range from 0.618 or 0.5 and 1.618 or 2.618.
Time frame analysis
The longer the time frame, the clearer the market’s view. This clarity is because there is a lot of noise in the market in the short span, increasing the volatility.

The time frame analysis describes the type of trader you are. The trade time frame for any asset can range between 15 minutes, 1 hour, weekly, and even monthly.
Types of time frames:
- Scalpers: 10 to 30 minutes of trading
- Day Trader: one day of buying and selling
- Swing Trader: a few days which extend till a few weeks
- Positional trader: trade time between weeks to 6 or 12 months
- Investors: trading for more than a year
The Conclusion
Reading crypto charts is important to make good trading decisions, Bitcoin Prime provides you the necessary knowledge to learn crypto charts. Making money in the market is inevitably imperative but learning the technical analysis and how to use its patterns and indicators can avoid the struggle.


